Program Details - Forecaster Retirement & Estate Planning
(The screen shots below are from the "example- retirement with spouse still working.frc" sample file, which is included in the download.)
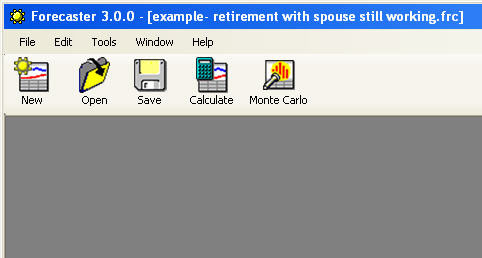
The retirement Forecaster program uses a master window that contains the child windows that are part of your Forecaster plan's definition and the results of the calculations. The master window is shown below. It provides the menus and tool bar icons for opening and saving files. It also provides the menus and tool bar icons for calculating the year by year results, and for performing the Monte Carlo simulation.
(Click to view full picture)
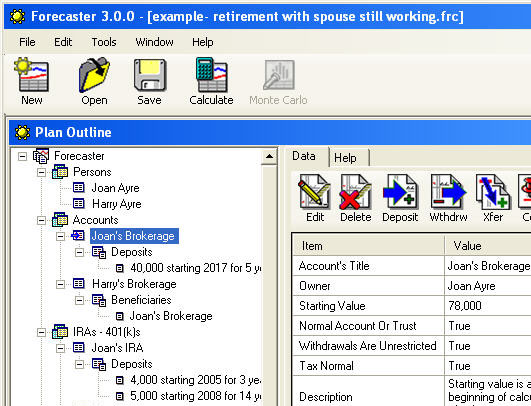
The retirement Forecaster program displays the elements of your retirement plan in the outline window shown below. There is a tree view of the plan elements on the left, and a table of data items and their values on the right. When you select one of the elements in your plan from the tree view, the table in the right-hand side of the window changes to show you the data values you entered for the element. The particular actions available to work on this element are indicated by the icons in the tool bar above the table. Double clicking on the table is a shortcut equivalent to clicking the left-most button (usually Edit).
(Click to view full picture)
You use the outline window for all your data entry and editing. The label used for each element in the tree view is taken from the information you enter when defining the element.
When your retirement plan is finished, you click on the "Calculate" button to generate the charts and tables for your plan.
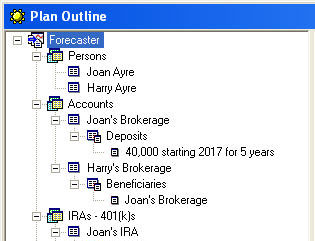
The Forecaster outline tree view has top level elements for the people in your plan, asset accounts such as investments and savings, special tax treatment accounts such as IRAs, annuities and life insurances, and your pensions. There is also a top level element to specify the assumptions to be used in calculating your financial forecast.
(Click to view full picture)
The first sublevel of the tree view allows you to define the individual parts of your plan, including the people in your family. The second sublevel of the tree view allows you specify details of each element such as beneficiary payments, deposits, costs, transfers, and withdrawals.
When you click on one of the tree view elements, the table of data items and their values on the right changes to provide information about that element. The icons on the tool strip above the table change to show the allowable editing operations.
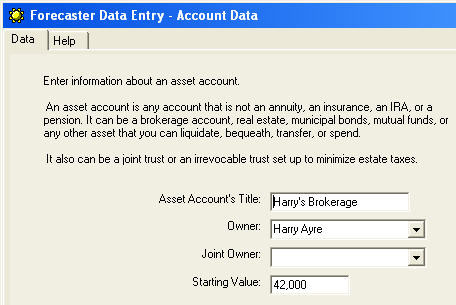
The Forecaster data entry window is used to specify the information for the outline elements. Each element has its own data entry form. The forms have multiple pages, with the "More..." button activated when there are additional pages to fill out. In some cases, the contents of the subsequent page are varied depending on the information entered on the prior page.
(Click to view full picture)
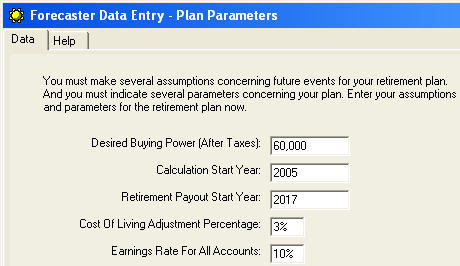
Your assumptions and parameters are entered in the data entry window associated with the "Parameters" element. When you have specified all your elements, you can test different assumptions by changing the values in this window. You can save plans with different assumptions under different file names for future reference.
(Click to view full picture)
When you click the "Calculate" button on the master window, the Forecaster program loops through all your data for each year in your plan and calculates the financial transactions for each year. This includes deposits, earnings, tax payments, and the allocation of funds for costs, transfers and fixed withdrawals. And it includes the major financial transaction, which is the yearly collection of monies from your accounts to fund your retirement life style. This amount is increased each year to keep pace with the inflation rate you specified in your assumptions.
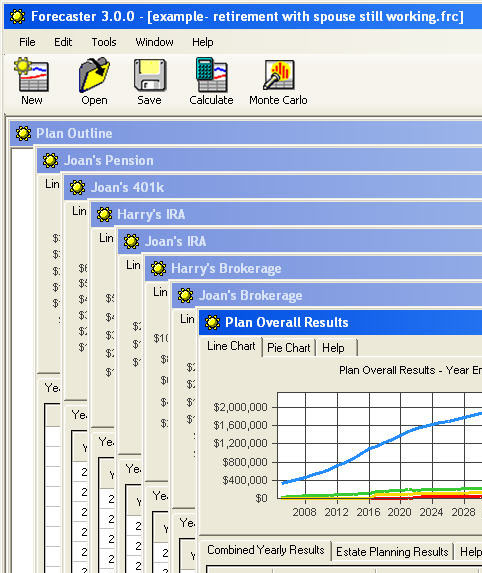
When the calculations are finished, the Forecaster program generates the charts and tables for your plan. With these you can see a year-by-year cash flow projection for each one of your asset elements, as well as one for your combined results. You can also see the results of your estate planning. This result is created using the fixed, average values of ROI and COLA that you specified, and is a good test of your plan's instructions. The full set of result windows is shown below.
(Click to view full picture)
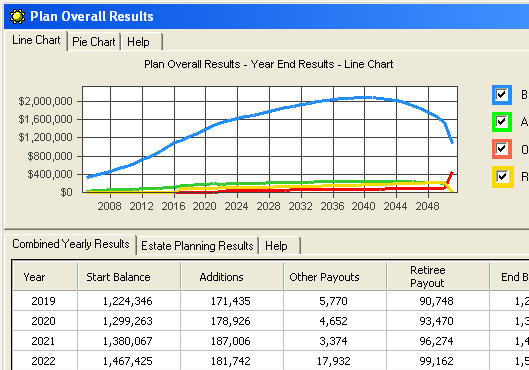
The window that shows the plan overall results combines all the financial transactions and shows a year-by-year summary of your financial situation.
(Click to view full picture)
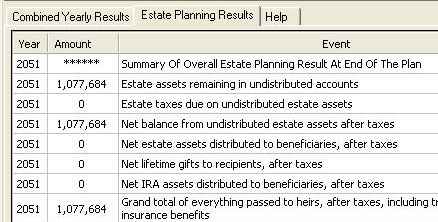
By clicking on the "Estate Planning Results" tab of the data table, you can see the results of your estate planning.
(Click to view full picture)
After running the calculation using the fixed, average values of ROI and COLA, the next step is to run the Monte Carlo simulation using uncertain values of ROI and COLA to determine the probabilities of your plan.
When you click the "Monte Carlo" button, a data entry window pops up to allow you to estimate the standard deviation of your ROI and your COLA rates. (This is also the last page of the data entry window for the plan parameters.) You can estimate one standard deviation, i.e. one that you are 68% sure of, or you can estimate two standard deviations, i.e. a range that you are 95% sure of. Whichever one you enter, the other is automatically calculated for you. You also specify the number of trials to run in the simulation, and you are advised of the time requred to complete the trials that you specify.
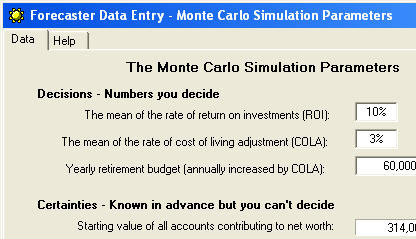
(Click to view full picture)
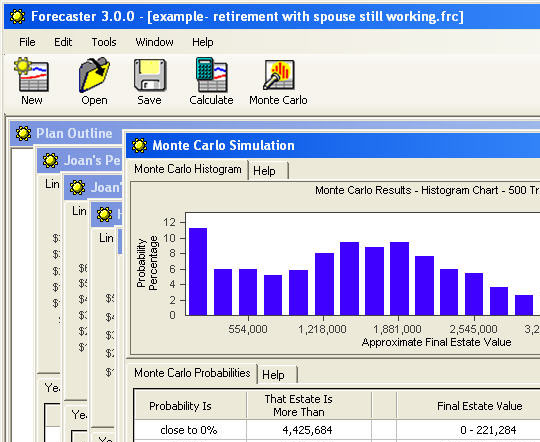
When you click the "Run Simulation" button on the Monte Carlo data entry window, the Monte Carlo simulation starts. A complete calculation of the year-by-year results of the plan is done for each trial, using random rates of ROI and COLA from a normal distribution, and the final estate value is added to the collection of values used to produce the histogram of probable estate values.
(Click to view full picture)
If you click to view the full picture in the example shown above, you can see that 7.6% of the trials resulted in an ending estate value of zero. When some of the random combinations of ROI and COLA are both adverse rates, the plan's investment accounts can go broke early in the year-by-year sequence, and then no subsequent combination of better rates will be able to adjust the end result higher. So there is a disproportionately high bar on the left end of the histogram that shows this affect.
