Use Decision Rules To Improve Your Retirement Withdrawal
Results
Every one wants to know how much they can withdraw from their retirement accounts to fund the expenses of their retirement lifestyle without exhausting their retirement portfolio. The problem is that varying rates of earning on your investments, varying rates of inflation, and varying tax consequences of certain withdrawals all combine to make it difficult to decide on a plan for safe withdrawals. Withdrawal decision rules provide parameters for changing the withdrawal rates that affect living expense funding during retirement years. The Forecaster program provides a way to use these rules to find the strategy to follow for achieving the best outcome.
Videos showing how to use withdrawal decision rules to improve your retirement portfolio payouts.
(These videos assume you have some familiarity with the Forecaster program.).
Demo 1 - Intro and simulation of Klinger's example with income tax added (15 min)
Demo 2 - Example with IRAs, pension income, and living expenses varied (11 min)
Demo 3 - More complexity with bear market investments, plus state income tax (8 min)
Forecaster Decision Rules Demo Plan Files (ZIP file)
Some recent research, using statistical probabilities of possible future rates of earning and inflation, has come up with rules of thumb such as withdrawing 4 percent per year over a 30 year retirement period.
A paper published by the Journal of Financial Planning in
2007,
written by William J. Klinger, titled "Using Decision Rules to Create Retirement Withdrawal
Profiles" shows that by applying some simple rules regarding the
size of your withdrawals, the sustainable portfolio withdrawal rate can be
higher than the rule of thumb rate. (These rules are explained later.)
But the paper does not consider tax consequences. What if your financial situation is
more complex than the simple assumptions in recent research and most retirement calculators? For
instance, most calculators do not attempt to model the impact of taxes on their
analysis. Just specifying
a withdrawal of X dollars does not account for possible tax costs on the
withdrawal. Those tax costs reduce the amount actually available for living
expenses. And what about the effect of taxes due on social security and pension income and
minimum required withdrawals from IRA accounts on the net payouts for living
expenses?
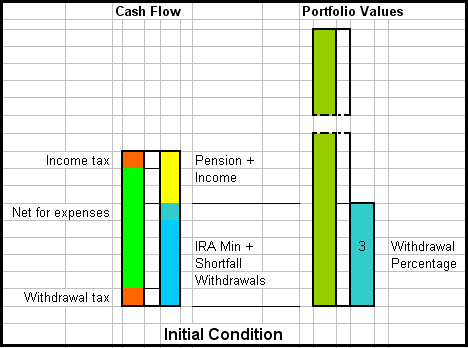
Consider
the problem of tax liabilities. An illustration of this situation is
shown
below. In the left hand side, the green defines the net after-tax money
desired
for retirement living expenses. The yellow and blue define sources of
money.
They have to add up to cover not only the living expenses, but also the
tax
amounts due, shown by the red. These taxes include capital gains tax
and IRA distribution tax (called withdrawal tax in the figure). The Forecaster program asks you for your desired after-tax
money, the green bar in the left hand side.
When the Forecaster program knows more detail about your
financial situation, then it can determine the after-tax value of your pension,
and it can determine the after-tax value of any minimum distribution
requirement from your IRAs. These amounts are used for your retirement living expenses,
but may not satisfy the total amount. In that case there is a shortfall and
other withdrawals will be done to makeup the shortfall. These withdrawals are
taken from accounts that may have certain tax consequence. The Forecaster
program uses its knowledge of these taxes to increase the withdrawal amount so
that the after-tax proceeds satisfy the shortfall in your living expenses.
Depending on account balances, the tax consequences may be different year to
year as different accounts are used, and the Forecaster program accounts for
this in its analysis.
Forecaster lets you specify your desired after-tax living expense amount, and
the program determines how much to withdraw to produce that amount after all
the tax consequences and other financial circumstances are considered. To do
this the program must know more about your retirement assets. How much is your
social security and pension, how much savings is in Roth IRAs, how much is in tax-deferred
accounts, how much is in long-term capital gains accounts? And in what sequence
are you using these different accounts for withdrawals?
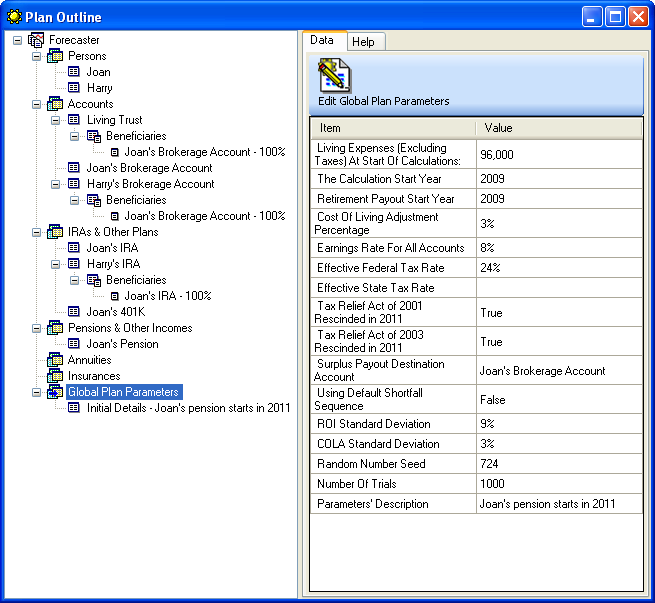
A screen
shot of how the Forecaster program represents your information looks like the figure below.
(All screen shots are from running the example plan file "Example Decision Rules For Knowledgebase.frc".)
The
Forecaster program includes test routines that use Monte Carlo simulation. A Monte
Carlo simulation runs a sequence of trials to test the results of withdrawing
money to fund your retirement living expenses. A single trial, using randomly
generated return on investment (ROI) rates and cost of living adjustment (COLA) rates for each year, calculates all the money
transactions, including tax consequences, to arrive at a final result.
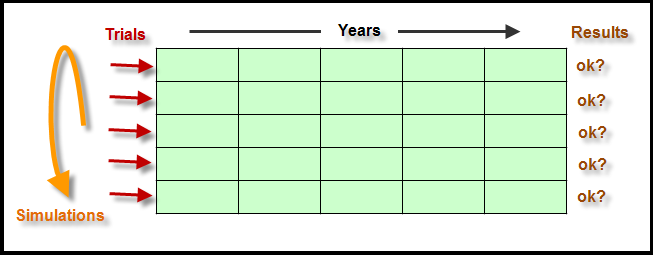
The Monte Carlo simulation runs as many trials as specified
by you, and then determines the probabilities for each of the results seen.
Each of the trials results in a final portfolio value, and a counter is kept
for each value that corresponds to a certain range. The number in each range,
evaluated against the total number of values, gives the probability of the
result falling within that range.
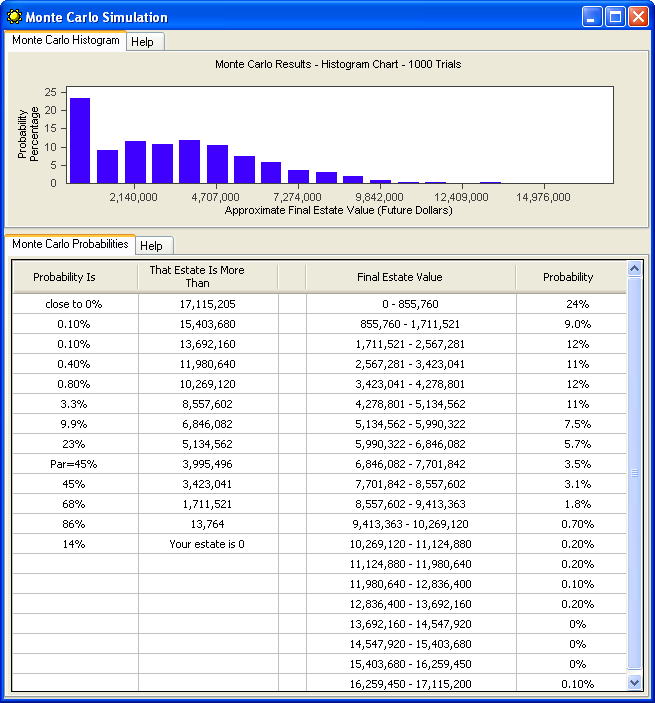
The result of the plain Monte Carlo simulation, without using withdrawal decision rules, looks like the
diagram shown below. The vertical bars are proportional to the number of times
a value within the corresponding range was seen. Notice the high proportion of
times when the portfolio went broke. In 14% of the trials, your portfolio ran out of money before the end of life expectancy.
To improve the odds of not running out of money a retiree can apply the
ideas of the Klinger paper,
which defines three rules that are used to change the size of yearly withdrawal rates:
(1) The Prosperity Rule raises the withdrawal rate when the portfolio
has a good year and the rate would otherwise fall below some threshold.
(2) The Capital Preservation Rule cuts the withdrawal rate increase
when it would otherwise exceed some threshold. (3) The Modified Withdrawal Rule
freezes the withdrawal rate when the portfolio has a negative year and
the inflation adjusted rate is beyond some threshold. The withdrawal
rate may thus be raised, cut or frozen, depending on the
portfolio performance and inflation. The Monte Carlo simulation
creates test cases of both bad and good years, and applies these rules
to adjust the portfolio withdrawal rate accordingly.
The Forecaster program gives you the capability of using these
withdrawal decision rules to explore their effect on the sustainability of your
portfolio withdrawals while also modeling the impact of taxes on the analysis. But instead of asking you for a starting withdrawal rate, as done in the Klinger paper, the program uses the after-tax
living expense
amount that you specify in your Forecaster plan file. If your
Forecaster plan starts before you retire, your specified living expense
amount is increased by the plan's COLA rate each year to estimate the living expense amount at the time of retirement.
Starting
with your after-tax retirement living expense amount, the Forecaster
program uses its knowledge of your assets to determine the actual
withdrawal
necessary to produce this living expense amount, taking into account
your
entire financial situation. This includes accounting for your pension
and other
income, IRA distributions, special cost instructions you specified for
sinking
fund accounts, and all the subsequent tax consequences. The tax rate
used is the effective tax rate as specified by you in your Forecaster
plan.
With the
resulting withdrawal amount, the Forecaster program uses your portfolio value
to calculate the withdrawal rate. This rate is used as the input to the
decision rules simulation logic. This logic uses the Modified Withdrawal Rule,
the Capital Preservation Rule, and the Prosperity Rule to modify the withdrawal
rate as appropriate. (These rules are described later.) Then the modified withdrawal rate is used by the
simulation logic to calculate a new after-tax amount available for your
retirement living expenses. This resulting value is used by the Forecaster
program’s cash flow projection routines for the year. Then this value is
adjusted by the inflation factor (COLA) to get the next year’s requested living
expense amount, which starts the procedure again.
A single
simulation trial does this procedure for each year in your retirement lifetime.
And many simulation trials are done to determine the success rate of your
withdrawal plan. The success rate is the ratio of the number of simulation
trials that leave some money in your estate, to the total number of simulation
trials. A success rate of 99% is the suggested goal to give you a high degree
of confidence in your plan. Remember that the information in these
forward-looking projections is based upon assumptions that involve risks and
uncertainties, and actual events or results may differ materially.
After the Forecaster program has finished a simulation using
multiple trials, a
window is created to show you the results. The window has charts and tables.
The chart pane of the widow shows a histogram of estate value probabilities, a
line chart of yearly expense funding, and a line chart of yearly portfolio
values. The table pane shows probabilities of year end results, and some
withdrawal accounting information that itemizes the first year’s transactions.
The result after running the example plan file is shown below.
Note that the portfolio went broke less than 1% of the time when using withdrawal decision rules
compared to 14% of the time without using any rules. The values used for the withdrawal decision rule parameters Fall, Raise, Exceeds, and Cut (described later) are shown in the table.
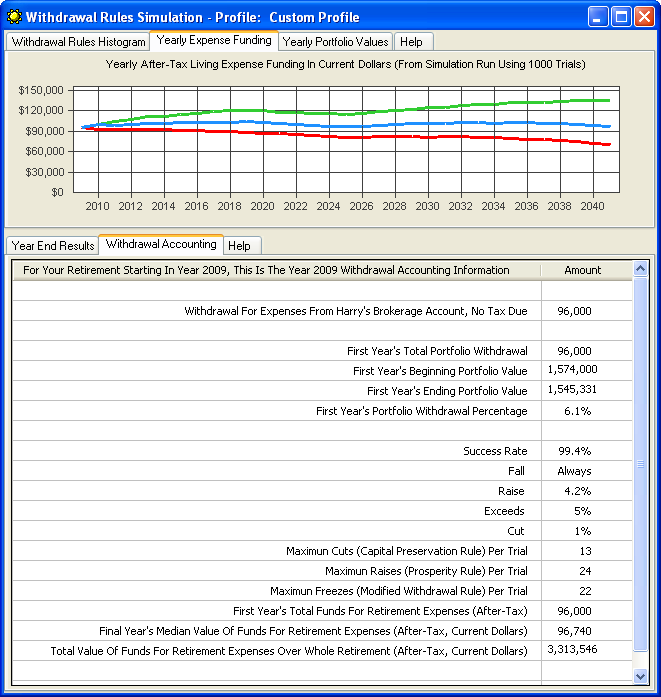
Each curve represents a specific
percentile of the range of results from the trials performed during the withdrawal decision rules simulation. The top green line is the 90th percentile. That is, 90% of
the results are less than this value each year. The middle blue line is the
50th percentile. This is the median of all the results for each year. The
bottom red line is the 10th percentile. Ten percent of the results are less
than this value each year. The output
values for the withdrawal
decision rules simulation are calculated as current
dollar values. Current dollars are dollars from other time periods converted
into present-day dollars, in order to factor out the effects of the simulated
inflation rates.
To improve
your success rate, you can modify the parameters of your Forecaster plan file.
The most obvious change to make would be to lower your requested retirement
living expense amount. You can alter the assumptions that you have entered,
such as rates for investment returns and inflation, and tax rates. Don’t forget
that these parameters can be specified as having different values for different
years during your retirement by using the parameter change instructions.
See
the parameter change knowledge base article.
To change the shape of the median value curve (the blue
line) you modify the values of the withdrawal decision rules parameters. These
can be changed in the data entry window that is presented to you before each
simulation run. See the figure below.
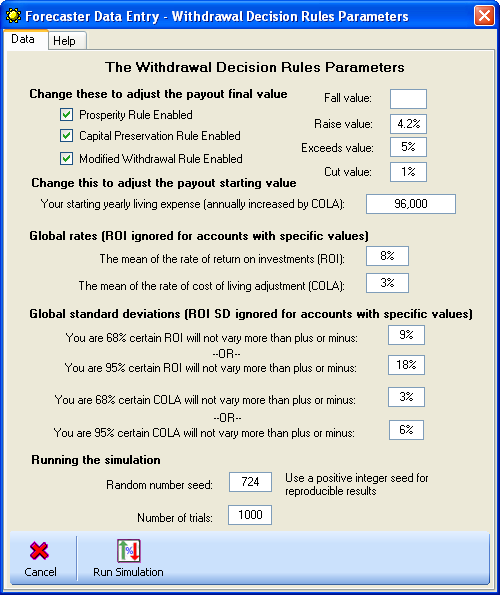
Please read
the Klinger paper for an understanding of the withdrawal
decision rules and how they can
affect your withdrawal results. The chart and table shown above were
created using the example plan file "Example Decision Rules For
Knowledgebase.frc"
with the decision rule parameter values shown here.
Fall, Raise, Exceeds, and Cut are variables that are set by you in this data entry
window. In addition, whole decision rules can be activated and deactivated
using the check boxes.
Prosperity Rule. If
the withdrawal rate in any year falls below the initial withdrawal rate by more
than a percentage Fall, the withdrawal rate is increased by a percentage Raise
Capital Preservation Rule. If the withdrawal rate in any year exceeds the
initial withdrawal rate by a percentage greater than Exceeds, the withdrawal rate for that year
is cut by a percentage Cut.
Modified Withdrawal Rule. When the retirement portfolio growth for the year is
negative and when the new withdrawal rate would be greater than the initial
withdrawal rate, then there is no increase allowed in the withdrawal rate. It
is held at the last year rate. There is no make-up for a missed increase.
Note the blank data entry box
for the Fall value.
The
Forecaster simulation logic has added one modification to the range of possible
values for Fall and Exceeds. These variables can now be blank (empty). When blank, the decision rule is always
applied, that is, the change specified by Raise or Cut is always applied. Note that the Modified
Withdrawal Rule can
still override and negate any increase from the other rules.
After each
simulation test, you examine the simulation outputs, and you make adjustments
to the decision rule variables for another simulation test.
The
Klinger paper puts the desired success rate at 99%. If your success
rate is 100%, you may be too conservative, and can afford to try for a
higher output for your retirement living expenses.
You should keep adjusting the parameter variables to obtain an output
result that shows just a 1% probability that your estate is 0, and
shows the desired final year’s payout.
During your retirement, the withdrawal decision
rules simulation should be run each year to arrive at the best withdrawal for
the year. By running the Forecaster program each year, using updated current
account values and the newest estimates for rates of investment return and
inflation, you can obtain a year-by-year guide to a sustainable
portfolio withdrawal plan.
Remember
that Forecaster’s creators are not financial planners, but are computer
programmers, and Forecaster’s internal processing logic, like all computer
software, may contain errors and omissions. The information from Forecaster’s forward-looking
projections is based upon assumptions that involve risks and uncertainties, and
actual events or results may differ materially. Information presented by the Forecaster program does not
constitute financial advice, and is made available to you solely for
informational purposes. The creators do not make any representation or
warranty, express or implied, as to the information’s accuracy or completeness.
Forecaster
does not make specific asset or security recommendations. You enter your desired
retirement year, income and retirement expense information, and expected
lifetime. Forecaster then runs simulations based on the
information provided to determine if your assets are likely to cover your
expenses over the life of the plan, during market conditions based on your
estimates. Results may vary with each use and over time.