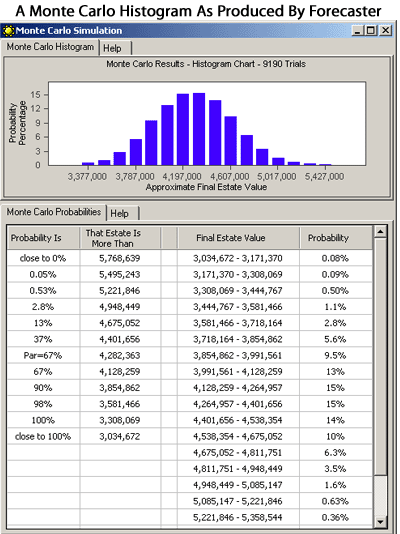
Monte Carlo Simulation
Forecaster Retirement & Estate Planning
Many times, when faced with an uncertainty, like future inflation or interest rates, you replace the uncertain number in question with a single average value. When you run the Forecaster calculation to produce the charts and graphs of your year-by-year cash flow projections, you are doing that. You are using the average values that you have specified for your yearly return on investment and yearly cost of living increases. But when you run the Monte Carlo simulation, you are using uncertain values, the variance of investment earnings and inflation increases, to assess an uncertain future.
(A very instructive discussion about how expected returns and expected fluctuations affect the likely outcomes of your investments is found at this page.)

The Forecaster calculation obtains the year-by-year results by using your specified cost of living adjustment to increase your specified retirement expense budget, and by applying your specified return on investment to all your investment account balances each year. The available money is then processed according to your plan’s instructions. Some is withdrawn to cover your retirement living expenses and your other, fixed costs. Some is transferred to your other accounts, or to trusts. Some is distributed as gifts to your heirs. The resulting balances are then processed in the same way for the next year, and so on, until the end of your forecast. The ending net worth is your final estate value.
This process is great for seeing charts and tables of how your financial strategy may work over the years. You can see how it affects your account balances and accomplishes transfers of money between your assets. Your goal is to manage your retirement expenses and end with a final net worth that is neither too large nor too small. Seeing this result as it is obtained with your average values will help you to understand how the plan you are preparing for the future will work. But it will not help you understand the risk of uncertainty in the process. The problem is that when the average of an uncertain number is plugged into the plan, it may not result in the average output of that plan.
The Monte Carlo simulation works with the uncertainties of interest rates and inflation rates and gives you the probability of achieving your final financial goal. After you have specified a financial plan that works to your satisfaction with calculations using your average values, you move to the next step and run a Monte Carlo simulation. To do this, you use two more specifications in your plan in order to quantify the uncertainties. These uncertainties are unknown in advance and you must guess at their possible range of values in order to run the simulation.
You must specify the possible variation in the earnings rate on investments and the possible variation in the inflation rate. You can pick a variation based on your belief that it is 68% certain that the variation will not be more than your number; this is the amount of one standard deviation. Or you can pick a variation based on your belief that it is 95% certain that the variation will not be more than your number, this is the amount of two standard deviations. As you can see, we are dealing with probabilities here, and you must make a best guess.
Forecaster again calculates the year-by-year results by applying your specified cost of living adjustment and applying your specified return on investment. But each time that it must use one of these rates in a calculation, it first uses your specified variation to obtain a new rate from a normal distribution to use in the calculation. So each rate calculation uses a randomly obtained rate value. This is done for each rate calculation in every year to the end of the plan. And then the whole process is repeated again and again for the number of trials you specified.
In each trial, the plan manages your account balances according to the plan instructions defined when you worked with the average values. This means that if the random interest rate values are on the low side of their probable values, and the random inflation rate values are on the high side of their probable values, you may run out of funds and your net worth may go to zero before the plan ends. If the plan cannot payout the required amount for your yearly retirement living expenses, the progress indicator changes from blue to red for the rest of the year’s calculations.
The end result of the Monte Carlo simulation is a "bell curve" histogram chart and associated tables showing the probability of different values of your final net worth, or estate value, at the end of the plan.
